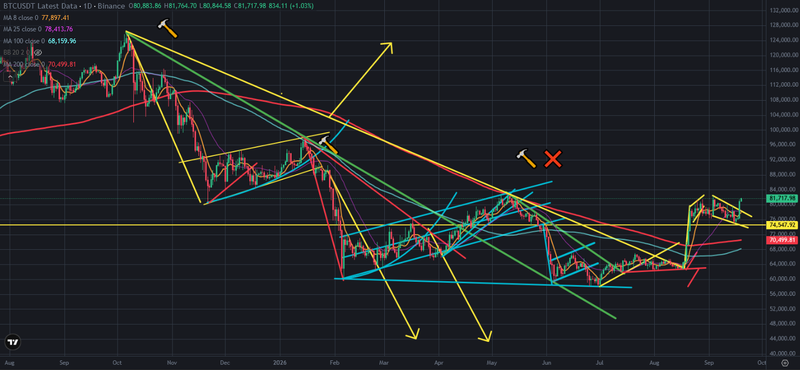
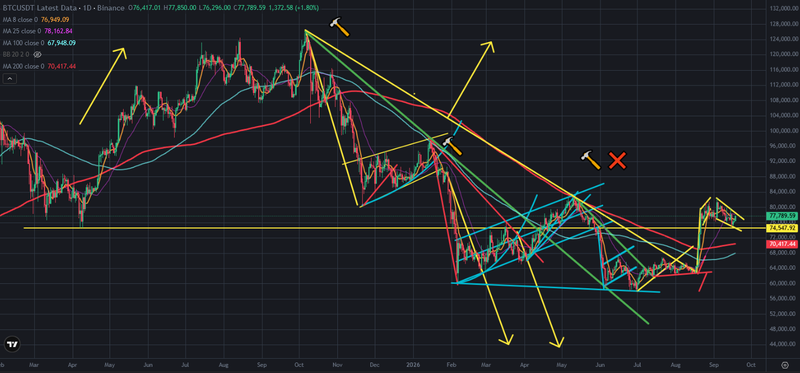
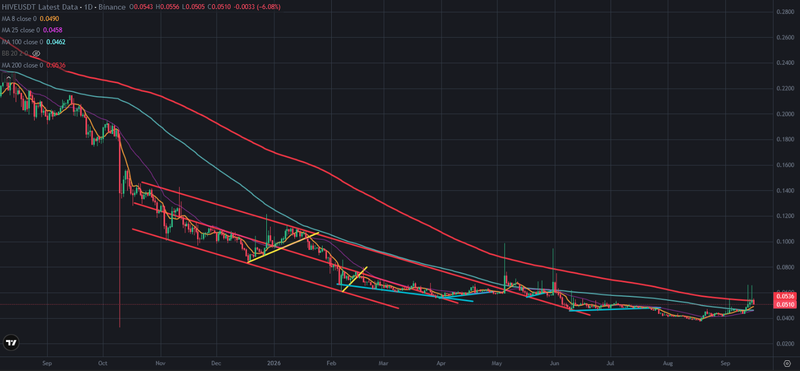
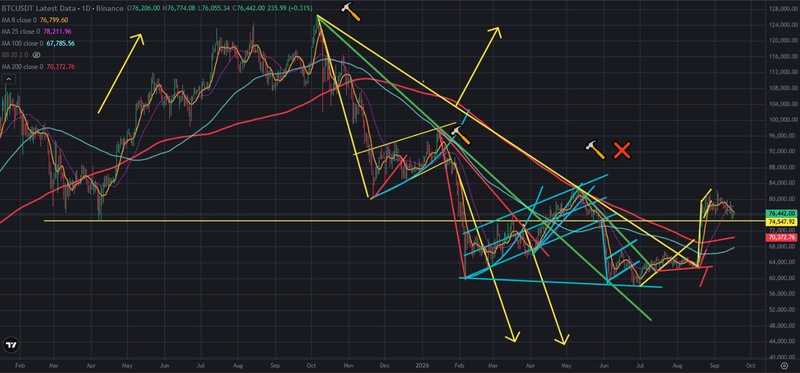
#cryptoblurtUnmoderated tag#cryptoblurtTrendingchorock in Blurt Investing C... • 2 hr. ago • 2 min readBitcoin Price Broke Up Mini Downtrend LineThere was falling wedge pattern on Bitcoin price chart. I shared an analysis about this pattern and I said It was possible to see breaking up the top line of this pattern. After I shared this analysis, Bitcoin price broke up the downtrend line on falling wedge pattern. After breaking up this resistance Bitcoin price touched 81,5K USD. Here you…chorock in Blurt Investing C... • 1 day ago • 2 min readMini Falling Wedge Pattern is on Bitcoin Price ChartThere is mini falling wedge pattern on Bitcoin price chart. I shared a few analysis about Bitcoin price chart and pointed possible support level on 75K USD. Bitcoin price supported by 75K USD level. and Mini falling wedge pattern appeared on Bitcoin price chart. Here you can see daily chart of Bitcoin price. Bitcoin price tried to break up 82K…chorock in Blurt Investing C... • 2 days ago • 2 min readHive Price Resisted by 200-Day Moving AverageHive price is in mini bullish trend. It tested 0,07 USD in this week. Even it reached this level, we can not see daily close above 0,06 USD level. There is great resistance on Hive price chart. This is why Hive price can not go up. Hive price resisted by 200-day moving average for 3 times. Here you can see daily chart of Hive price. Hive price…chorock in Blurt Investing C... • 2 days ago • 2 min readBitcoin Price is on One of Great Support LevelThere is one of great support level on Bitcoin price chart. Bitcoin price is close to touch this great support level. We may see Bitcoin price supported by this support level. Here you can see daily chart of Bitcoin price. Bitcoin price went up fast from 60K to 80K. Even it went up fast, it could not break up 82K USD level. It was important for…chorock in Blurt Investing C... • 5 days ago • 2 min readBitcoin Price Closed the Week at Lowest LevelBitcoin price got -4% weekly red candle in last week. Bitcoin price can not break up 82K USD level where is the last high level. It should be broken up to enter bullish season. But Bitcoin price can not break up this level. Here you can see weekly chart of Bitcoin price. Bitcoin price got huge weekly red candle after doji candle. Weak candles…